![haut[nah] Markenlogo in Weiß auf transparentem Hintergrund](https://cdn.prod.website-files.com/67d193280f08b335bf746dd1/67d199109476ad5a064d14d9_haut%5Bnah%5D-wei%C3%9F-transparent.svg)
/ MAGAZIN
7 festivals, 24 videos, over 3 million organic views – that’s our 2026 festival summer by the numbers. On average, each video pulled in 118,500 views with an engagement rate of 2.7% across all festivals. The top-performing individual video, the Ikarus Friday recap, reached 242,000 views on its own. Here, we show what’s behind the numbers – and why they’re more than just nice statistics.


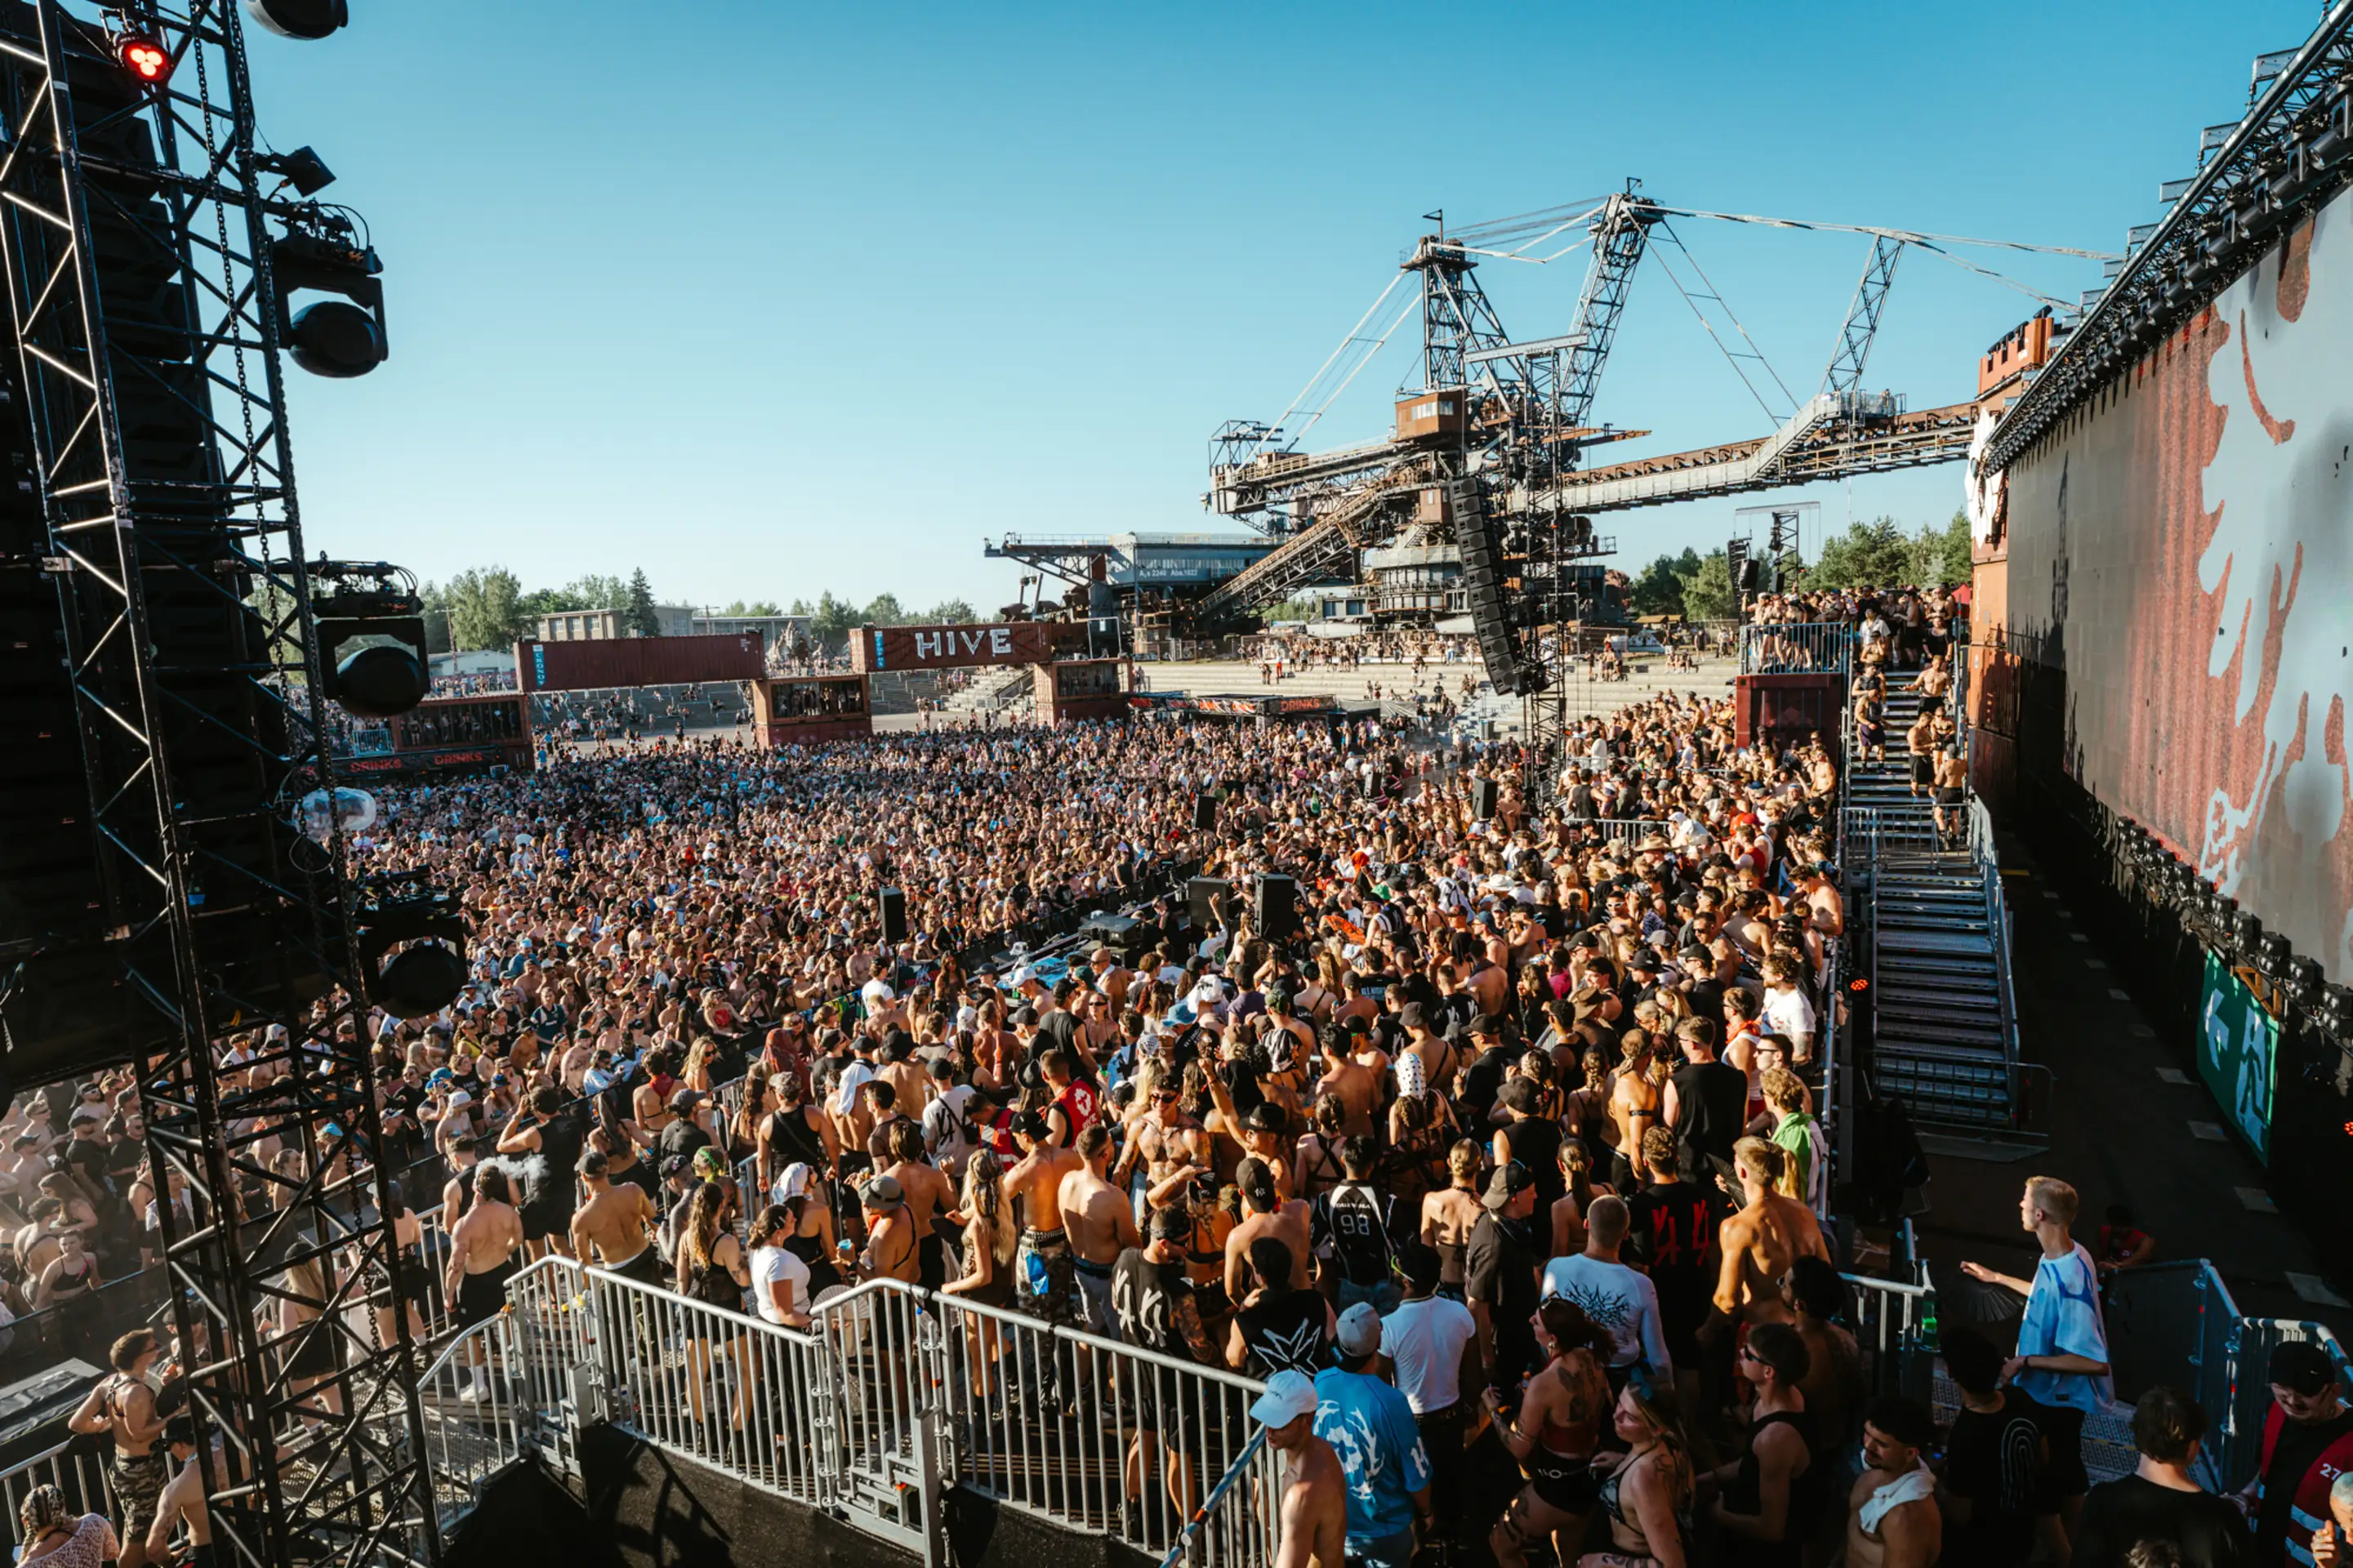
Leading the pack is Hive with an average of 184,200 views per video and over 1.5 million total views – though Hive consisted of several one-shots and teasers rather than classic recaps, so it can’t be compared 1:1 with the other festivals. Among the actual recaps, Ikarus performed the strongest: 164,700 views on average and approx. 500,000 total views. Close behind is Electrisize with 132,500 views per video and approx. 530,000 in total – giving it the highest overall reach of all festival recaps, despite slightly lower average values per video. Echelon and Time Warp were in the mid-range, with approx. 380,000 total views. Isle of Summer reached nearly 300,000 total views. Bringing up the rear is ab geht dieLutzi! with around 105,000 total views – significantly smaller than the other festivals, but still solid with an engagement rate of 2.7%.
Of course, it’s important to consider the number of assets, the duration and size of the festival, and the output. Since every festival is different, these are just insights and cannot be compared 1:1.
(As of: 10/06/2026)
Top 5 by views:
Views alone don't tell the whole story. Our experience shows that the biggest festivals don't always generate the most impressions. This depends on many different factors.
In plain terms, this means for evaluation: reach shows how many people see the content – the interaction rate shows how much it compels them to react. Only together do they provide the full picture.
It means that consistent, professional social videos pay off throughout the entire season – not just during the festival. We continue to deliver reels after the festival that can then be used for social media ads and selling new tickets. Incidentally, our strongest results came from festivals where we also invested more technically: at the Ikarus Festival, for example, FPV and cable cams were used in parallel (more on this in the Ikarus article) – and that is exactly where the strongest individual recap of the season came from.
How are the views counted?
All figures are public Instagram numbers as of October 6, 2026 – meaning what is publicly visible on the respective profiles.
What is a good interaction rate for festival content?
Our seasonal range was between 0.9% and 4.5%, with an average of 2.7%. Values around 2–3% are a solid result for recap content on Instagram. These are Organic Content and no paid media, which is a decisive factor and speaks for our results.
Do you post during the festival or only afterwards?
Depending on the format: teasers and initial clips often during the festival, stage recaps and thematic videos often afterwards for promotional purposes.
![ht[nh] Markenlogo in Weiß auf transparentem Hintergrund](https://cdn.prod.website-files.com/67d193280f08b335bf746dd1/67d19a1056a8ea42a159bf0f_ht%5Bnh%5D-wei%C3%9F-transparent.svg)


![Die drei haut[nah] Gründer posieren im Studio vor orangefarbenem Hintergrund](https://cdn.prod.website-files.com/67d193280f08b335bf746dd1/69a9999d690ad96c2c7ea1a3_HL004073.webp)